

Given the growing importance that digital products play in an organisation’s success, the responsibilities that engineering leaders now carry are heavier than ever before. From delivering high-quality software on time and within budget to ensuring your team is performing at its best, there are a multitude of priorities you must juggle at any one time.
So, wouldn’t it be nice to have some tangible facts and figures on how your team is tracking, what they’re accomplishing and how you can help them improve? That’s where DORA metrics come in.
What are DORA metrics?
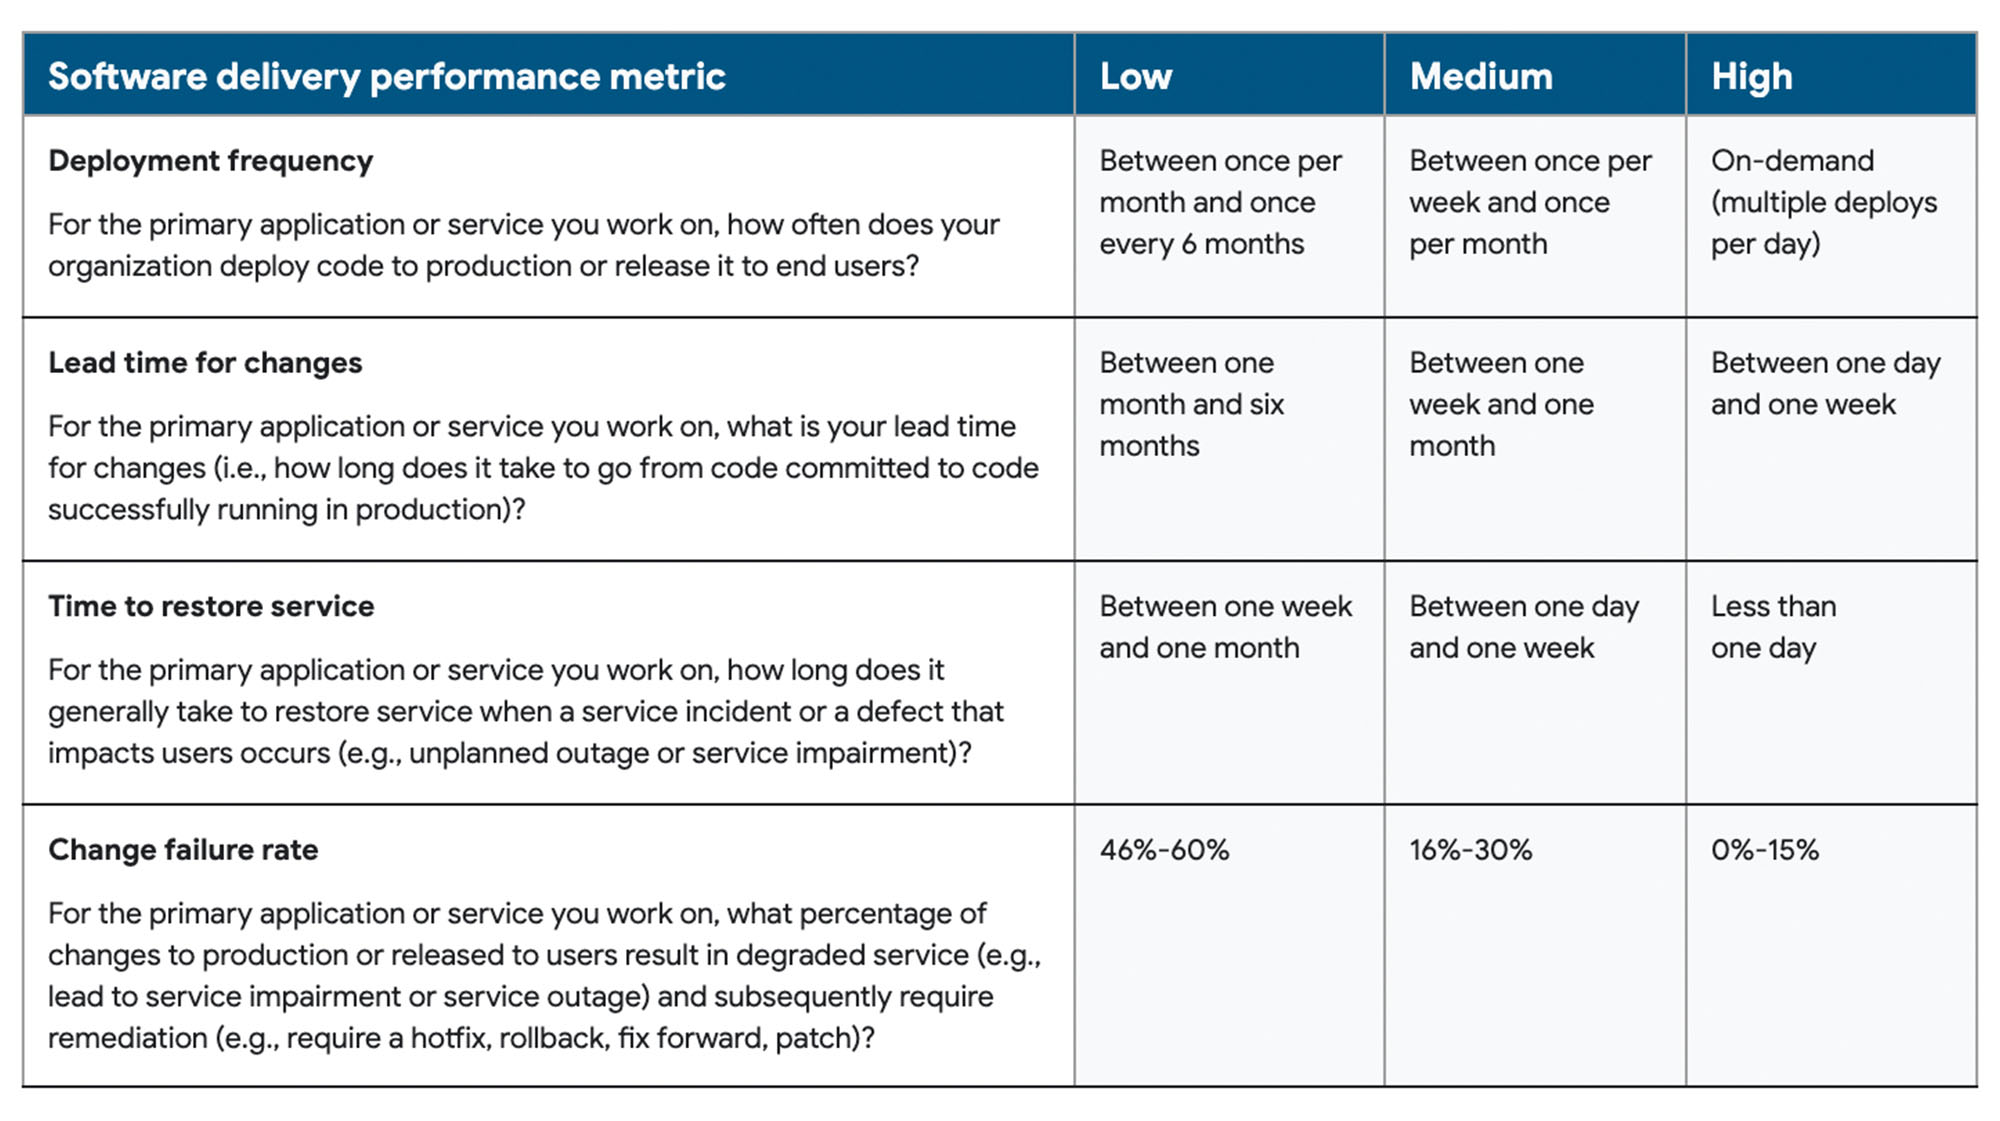
The term DORA comes from Google Cloud’s DevOps Research and Assessment, which is a research organisation that studies and evaluates software delivery and operations practices. DORA identified a set of metrics that are key indicators of high-performing teams, which originally came from an analysis of Google’s own teams. They are…
- Deployment frequency
- Lead time for changes
- Mean time to recover
- Change failure rate
Let’s take a closer look at each of these metrics and why they’re important.
Deployment Frequency
Deployment frequency is the measure of how often features are deployed to production. This metric is important because it reflects how quickly your team can deliver new features or bug fixes to users. A higher deployment frequency indicates that your team is able to move quickly and respond to changing requirements or user feedback. However, a high deployment frequency can also lead to increased risk, so it’s important to balance speed with quality.
How to measure
Track the number of deployments to production per unit of time (e.g. per day, per week, per month etc.). You can then use this data to identify trends and patterns over time and work with your team to optimise the deployment process.
Lead Time for Changes
Lead time for changes refers to the amount of time it takes a commit to get into production. This provides a better understanding of your team’s cycle time and how an increase in requests is handled. A shorter lead time for changes is proof that your team can deliver new features or bug fixes to users in a timely manner.
This is also critical to understanding the size and scope of deployments. A faster lead time implies quicker, smaller releases. A longer lead time implies larger, riskier changes, as commits tend to “batch up” into single releases.
How to measure
Track the time from when a code change is committed to when it is deployed to production. You can then use this data to identify bottlenecks in deployment, introduce more automation or split up features into more manageable units.
On a side note, there’s a concept called ‘feature cycle time’, which is often used in place of lead time for change. It’s effectively the same, just at a feature level instead of the commit level. This is tracked via tools like JIRA and Trello, as it’s possible to see when features were moved from ‘In Progress’ through to ‘Done’.
Mean Time to Recover
Whereas the previous metrics were more about velocity, mean time to recover is concerned with how long it takes to recover from a production incident or outage. No matter how good your team may be, unplanned incidents are inevitable. So, knowing the time it takes to respond and resolve issues that impact users is an invaluable metric. A shorter time to recover not only encourages engineering teams to build robust systems, it also instils a sense of confidence around experimentation and innovation.
How to measure
Track the time from when an incident is reported to when service is fully restored. You can then ask yourself, ‘are there delays in incident response?’ and ‘are there gaps in the monitoring and alerting process?’. Continuous monitoring may be required to prioritise recovery.
Change Failure Rate
Primarily concerned with software quality, change failure rate measures the percentage of deployments that result in a failure or service impairment. Essentially, this reflects the quality of your team’s code and testing processes. While change failure rate prevents a team being misled by the total number of failures they encounter, it can also indicate how much time is spent on rectifying problems rather than developing new projects. According to the DORA report, high performers fall somewhere between 0-15%.
How to measure
Track the percentage of deployments that result in downtime, degraded service or rollbacks. To improve this metric, teams can look at cleaning up known problem areas of the code, increasing the efficacy of code review processes, or investing in automated testing. This can also be a great method to identify and reveal tech debt, as repeat reasons for failed releases may reveal a deeper technical problem.
Why are these metrics important for engineering managers?
DORA metrics provide a concrete framework for breaking down complex software development and delivery processes, making them more visible and easier to understand. In turn, this enables engineering leaders to make steps towards streamlining workflows and enhancing the overall efficiency of engineering work.
Key benefits of implementing DORA metrics include:
1. Improving software delivery performance
DORA metrics offer a standardised framework that enables DevOps and engineering leaders to measure the efficacy of software delivery. Deployment frequency and lead time for changes help teams to measure velocity and agility, while mean time to recover and change failure rate help measure stability and quality. By breaking software delivery down into these easy to consume chunks, engineering leaders can spot areas for improvement and understand what actions must be taken to streamline the entire process. This can lead to quicker development, higher quality, better stability and greater accountability.
2. Empowering teams with agency over tech debt
A common use case for DORA metrics is to provide engineering teams with a tangible artefact that indicates progress. This makes it much easier to then approach other teams in product or design to get technical work prioritised and actioned. A lot of the time, tech debt is hard to justify and difficult to sell because it’s not direct value-add feature work. But with indisputable DORA metrics to hand, this becomes a lot easier for engineering teams to get over the line.
3. Promoting best practice engineering
In practice, DORA metrics have a high degree of cooperation. If introduced and weighted equally, a team may try to improve lead time to change by, for example, deleting or omitting tests to speed up deployments. However, this may reduce their change failure rate and expose issues in time to restore as bugs may slip through the net and testing hotfixes becomes harder. By comparison, making the tests faster both helps with improving lead time to change and time to restore. This in turn will improve deployment frequency. Essentially, any improvements require engineering best practice to solve within the virtuous cycle of DORA.
4. Benchmarking against industry standards
Widely recognised as a standard for measuring software delivery performance, DORA metrics allow engineering managers to compare their team against peers, competitors and best practices. It is then much easier to see how teams are falling behind, and where resources can be focused to catch up.
5. Aligning with business goals
DORA metrics can be closely tied to business goals, such as delivering new features to customers quickly while minimising downtime. They can also play a big role in value stream management to create end-to-end visibility of the entire production process. By presenting data-driven metrics that demonstrate team performance, engineering leaders can build trust and credibility with decision-making stakeholders.
In summary
DORA metrics provide engineering leaders with a data-driven approach to measuring software development and delivery performance. With the help of these metrics, leaders can gain visibility into the efficiency and reliability of their teams’ processes, enabling them to make informed decisions and take action to optimise software delivery pipelines.
By establishing specific and achievable objectives, engineering leaders can also drive continuous improvement, ultimately delivering better software, faster, while simultaneously increasing team morale and fostering a culture of learning and growth.